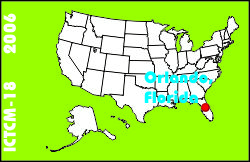
Electronic Proceedings of the Eighteenth Annual International Conference on Technology in Collegiate MathematicsOrlando, Florida, March 16-19, 2006Paper M002
Electronic Document Considerations |
Sarah L. MabroukFramingham State College 100 State Street P. O. Box 9101 Framingham, MA 01701-9101 USA smabrouk@frc.mass.edu list of all papers by this author |
| Click to access this paper: |
ABSTRACT
Readable / comprehensible graphs are needed for course documents printed for in-class use or posted online, as well as, for student assignments turned in electronically or posted online. We discuss how to use MS Excel and Winplot to create and to export graphs for data and functions in 2-space and 3-space.Keyword(s): software, spreadsheets
