|
Abstract Demos with Positive Impact is a project to connect mathematics professors with effective instructional tools. This NSF-supported project is developing a web-based database of instructional demonstrations for teaching concepts across the mathematics curriculum. In this paper, we highlight several of the demos in the collection and provide an invitation for participation in the project. Introduction The primary goal of Demos with Positive Impact is to develop an extensive database of instructional demonstrations for teaching concepts across the mathematics curriculum. In order to build the database, it is necessary for us to collect and disseminate demos that our colleagues and peers have used to make a positive impact on learning. A demo is a vignette, designed to be incorporated within a lecture that engages the learner on a level in addition to the oral presentation of the instructor. In contrast to student activities such as labs or projects, these vignettes are intended to be delivered by the instructor. Using demos in class can provide students with a situational or visual model of a concept. By establishing connections we provide an opportunity for students to construct a chunk of ideas instead of a list of seemingly unrelated facts. Thus, by using effective demos within a classroom presentation, the instructor serves as a facilitator for understanding. The project focuses on demos that use some form of instructional technology, however, the "technology of the day" may not involve calculators or computers. Rather, the concept may be illustrated in an interesting way using some physical object. In this article we discuss some tips for developing effective demos and highlight some of the inspiring demos that are currently in the database. In addition, we offer an invitation for participation in the project both as contributor and as user. The "Art" of Developing Effective Demos Using demos in class can provide students with a situational or visual model of a concept. By establishing connections we provide an opportunity for students to construct a chunk of ideas instead of a list of seemingly unrelated facts. Demos can be used for a variety of purposes including:
If some visual presentation is part of the demo, extra care must be used. The basic warnings are: Keep it simple, Keep it short (you can repeat it as needed), Go slowly, and Carefully plan the accompanying dialogue. We
must keep in mind that students are seeing it for the first time and they
need time to assimilate what you have developed. Keep verbiage on images
to an outline form. If students are taking notes, resist the temptation to
change overheads or screens too quickly. Don't be anxious to click that
mouse to go to the next phase. (Handouts that include an outline are often
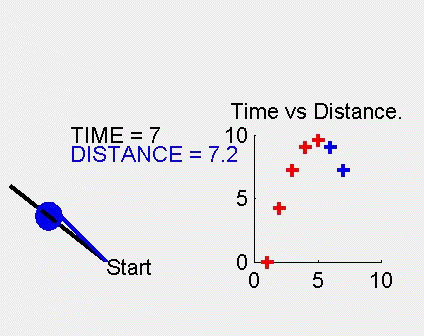
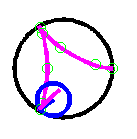
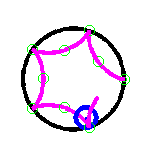
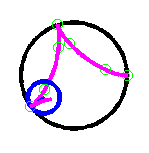
very helpful.) Experienced mathematics teachers have over time, developed, refined, and sifted through collections of instructional demos. They have personally stocked their teaching kits with demos they have found to be effective. The communication of these personal toolkits to others in the profession has the potential to greatly improve mathematics instruction and benefit our student's learning. Demos with Positive Impact is directed toward establishing a web-based collection of tried-and-tested instructional demos, some of which are highlighted in the next section. "I wish I'd thought of that!": Some Inspiring Demos In our professional development as mathematics instructors, occasionally we encounter an idea that invokes the personal reaction "I wish I'd thought of that!" Such is the case with the four demos that are highlighted here. Parabola! Often the conic sections are introduced as, literally, "sections of a cone." One way to illustrate a parabola is to slice a cone with a plane in a prescribed manner. Mathematically, this is absolutely correct. The problem is that students may not see nor appreciate the significance to their lives of slicing a cone. However, if we can demonstrate how graphs of parabolas result in the course of a real-life phenomenon, it makes sense to think that this can motivate students to think of parabolas as being "real." The demo involves collecting data that shows the progress of a ball as it is pushed up an inclined plane. As the ball moves up and then down the inclined plane, its position is recorded using a motion sensor. The time vs. distance graph is displayed on a computer monitor and is the graph of a parabola. (Figure 1) An animated graphic is used to illustrate the experiment and the results of the data collection (click on the figure to see the animation in a new window). The demo description, as it appears in Demos with Positive Impact, illustrates how the demo can be used in a classroom setting. In addition, it gives details of equipment needed and suggestions on additional activities to accompany the demo. It is an excellent introduction to the study of quadratic functions and because it involves basic ideas to which students can easily relate, provides a realistic motivation for understanding such functions. Cycloids A cycloid is the path traced out by a point on the circumference of a circle as the circle rolls (without slipping) along a straight line. A cycloid can be drawn by a pencil (chalk or marker) attached to a circular lid which is rolled along a ruler. Figure 2 illustrates the generation of a cycloid (click to see the animation in a new window). This demo uses cycloids to demonstrate the power and utility of parametric equations and parametric plotting. As it appears in Demos with Positive Impact, the demo illustrates several constructions of cycloids, including hypocycloids (Figure 3) and epicycloids, giving parametric representations of the curves. By clicking on each of the images below, a new window is opened to display the corresponding animation.
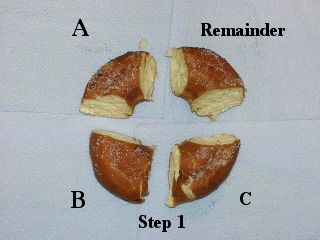
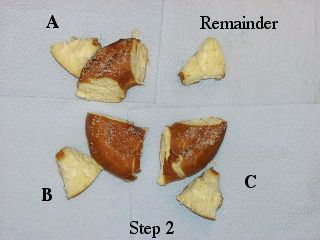
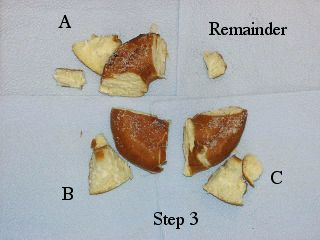
Descriptions of physical constructions of the various cycloids are given along with animated graphics and software codes to produce the animations. A Sweet Introduction to Infinite Series An introduction to infinite series often proves to be a painful experience for instructors and students alike. Students sometimes have a difficult time believing that a sum that has an infinite number of (positive) terms can be finite. If they can be convinced that such a sum exists, it is difficult to imagine that a series such as the harmonic series actually diverges. For instructors, the difficulty often lies with the fact that we feel "stuck" with only formal definitions. Not all students understand the abstract ideas; students from applied science and engineering often need a more visual or intuitive model of what actually happens with infinite series. The demo, A "Sweet" Introduction to Infinite Series, provides physical model that effectively conveys a concrete concept image of the abstract ideas of terms of a series, partial sums of an infinite series, convergence, divergence, alternating series, and divergence of the harmonic series. In this demo, the instructor divides a donut among 3 volunteers and students keep track of how much the volunteers receive. Figure 4 illustrates the progression of the amount of donut each student receives and the remainder.
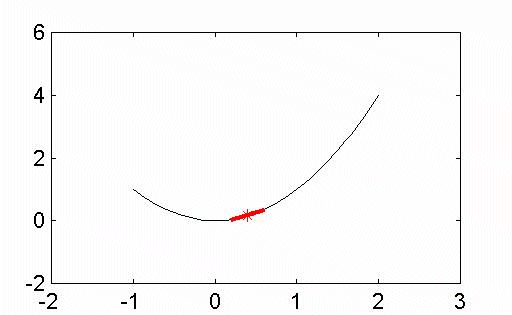
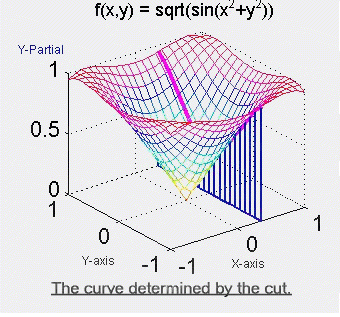
This demo holds the attention of the class and accurately introduces the concepts about infinite series that students need to understand. In one 50 minute lecture/demonstration, students are introduced to fundamental concepts as well as alternating series and the harmonic series. Partial Derivatives, Geometrically Students in multivariable calculus classes readily adjust to partial differentiation by using standard differentiation techniques, just "pretending" that all the unknowns, except the one they differentiate with respect to, play the role of constants. This algebraic technique leads to success in the partial differentiation process, however, few students have a clue as to what is going on from a geometric point of view. This demo provides a visual foundation for the meaning of the partial derivative by making a connection to geometry of the derivative of a function of a single variable. We can think of obtaining the values of f '(x) from the slopes of moving tangent line segments as shown in Figure 5. A similar argument applies when we want to discuss the partial derivatives of z = f(x,y) with respect to x or y. We say, 'one of the unknowns is held fixed at a particular value'. For the purpose of this explanation, suppose x = a is that value. To represent the situation graphically, we then take a plane perpendicular to the x-axis at x = a and 'slice' the surface to generate a curve which has equation z = f(a, y). Then the partial derivative of f with respect to y when x = a corresponds to the slope of a tangent line segment moving along this curve, illustrated in Figure 6. Click on the image to see the complete animation. This demo provides a lecture tool that has been used successfully in both small and large classes for both math/science and non-science majors. It is simple to use and allows the instructor to narrate the actions as they evolve on the screen. The demo gives a visual enhancement to the usual algebraic statements about partial derivatives. An Invitation Experienced mathematics instructors have their own personal toolboxes of effective teaching ideas and demos. Every mathematics instructor is looking for new ideas that will help get the concepts across to the students. The success of Demos with Positive Impact will depend on instructors who are willing to share their clever ideas for demos and on instructors who come to the database as an end-user. We invite you to submit your tried-and-tested ideas. In addition, we invite you to use the demos in the database and give us your feedback. The URL for Demos with Positive Impact is http://www2.gasou.edu/facstaff/lroberts/demos. In addition to the demos in the database, you will find an online demo submission form along with a feedback form. Please get involved in this project. We need your help and your feedback. Acknowledgement |

